
A Beginner's Guide to Data Wrangling and Visualization with Pandas, NumPy, and Matplotlib


Introduction
In the realm of data science and analysis, three fundamental libraries stand out as the pillars of efficient data manipulation and visualization: Pandas, NumPy, and Matplotlib. These tools are essential for anyone diving into data analysis, whether you're a beginner or a seasoned pro. In this guide, we'll explore the basics of each library and how they work together to streamline the data analysis process.
Getting Started with NumPy
Getting Started with NumPy NumPy, short for Numerical Python, is the foundation upon which many other data science libraries are built. At its core, NumPy provides support for multi-dimensional arrays and matrices, along with a collection of mathematical functions to operate on these arrays efficiently.
Installing NumPy:
NumPy is a powerful Python library for numerical computing that provides support for large, multi-dimensional arrays and matrices, along with a collection of mathematical functions to operate on these arrays efficiently. To install NumPy, you can typically use Python's package manager pip:

Creating NumPy arrays:
NumPy arrays are the core data structure of the NumPy library. You can create NumPy arrays in various ways:
Using Python lists:
numpy.array([1, 2, 3])Using built-in functions:
numpy.zeros((3, 3))(creates a 3x3 array of zeros)Using random number generation:
numpy.random.rand(3, 3)(creates a 3x3 array of random numbers)
Array manipulation and operations:
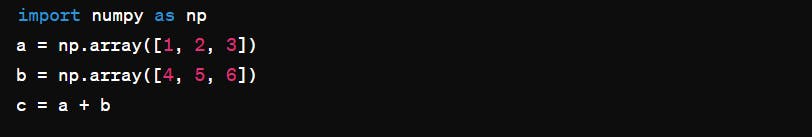
NumPy provides various functions for manipulating arrays, including reshaping, concatenating, splitting, and stacking arrays. Basic operations like addition, subtraction, multiplication, and division can be performed element-wise on arrays. For example:
Universal functions (ufuncs):
Universal functions, or ufuncs, are functions that operate element-wise on NumPy arrays. They are vectorized wrappers of simple functions that take one or more scalar values and produce one or more scalar results. Examples of ufuncs include np.sin(), np.cos(), np.exp(), etc. They are highly optimized and can significantly improve performance when operating on large arrays.
Indexing and slicing arrays:
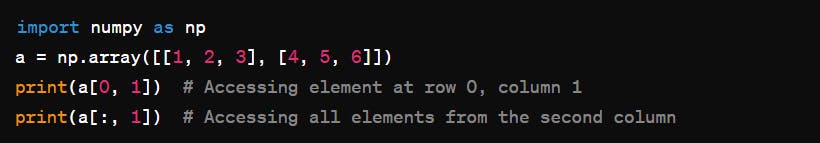
NumPy arrays support powerful indexing and slicing operations to access specific elements or sub-arrays. You can use integer indexing, boolean indexing, slicing with colon notation, and fancy indexing to extract elements from arrays efficiently. For example:
Broadcasting:
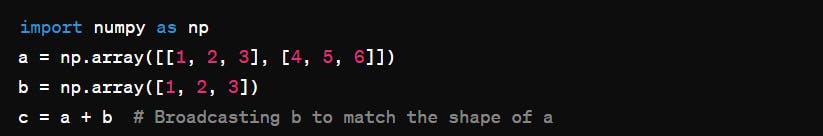
Broadcasting is a powerful mechanism in NumPy that allows arithmetic operations to be performed on arrays of different shapes. When operating on two arrays, NumPy compares their shapes element-wise. It starts with the trailing dimensions and works its way backward, broadcasting dimensions when necessary to make the arrays compatible for the operation. Broadcasting typically involves operations like addition, subtraction, multiplication, etc., where NumPy automatically expands smaller arrays to match the shape of larger arrays. This makes it possible to write concise and efficient code without explicit looping. For example:
Data Manipulation with Pandas
Pandas is a powerful library built on top of NumPy, designed specifically for data manipulation and analysis. It introduces two key data structures: Series (1-dimensional) and DataFrame (2-dimensional), which allow for easy handling and manipulation of tabular data.
Installing Pandas:
Pandas is a popular Python library used for data manipulation and analysis. You can install Pandas using pip, the Python package manager. Here's how you can do it in your command line or terminal:

Creating Series and DataFrames:
Series: A one-dimensional labeled array capable of holding data of any type. You can create a Series using
pandas.Series()constructor.DataFrame: A two-dimensional labeled data structure with columns of potentially different types. You can create a DataFrame using
pandas.DataFrame()constructor.
Loading and saving data:
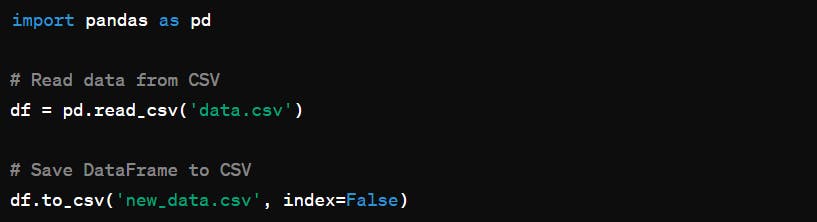
Pandas provides various functions to read data from different file formats like CSV, Excel, SQL databases, JSON, etc., and save data to these formats. For example:
Data indexing and selection:
Pandas provides powerful tools for indexing and selecting data from Series and DataFrames. You can use methods like .loc[], .iloc[], and boolean indexing for selection based on labels, integer location, and boolean conditions, respectively.
Data cleaning and manipulation techniques:
Pandas offers various methods for data cleaning and manipulation, such as:
Handling missing values (
dropna(),fillna())Removing duplicates (
drop_duplicates())Changing data types (
astype())Renaming columns (
rename())Filtering rows and columns
Applying functions element-wise (
apply())
Grouping and aggregation:
Grouping involves splitting the data into groups based on some criteria, applying a function to each group independently, and then combining the results. Aggregation functions like sum(), mean(), count(), etc., are commonly used after grouping. For example:

Data Visualization with Matplotlib
While NumPy and Pandas excel at data manipulation, Matplotlib is the go-to library for creating visualizations from that data. With Matplotlib, you can generate a wide variety of plots and charts, ranging from simple line plots to complex 3D visualizations.
Installing Matplotlib:
Matplotlib is a popular Python library used for creating static, animated, and interactive visualizations. You can install it using pip, the Python package manager. Here's how to install it:

Basic plotting with pyplot:
Matplotlib's pyplot module provides a simple interface for creating basic plots. You can create plots by providing lists or arrays of data to functions like plot(), scatter(), bar(), etc. For instance:

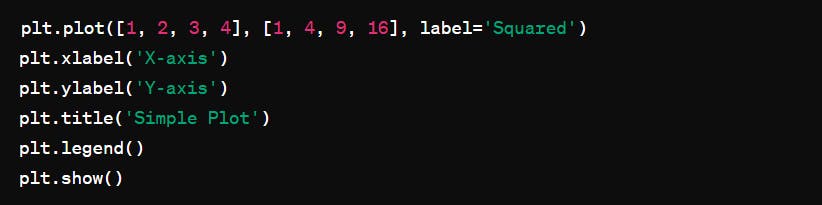
Customizing plots with labels, titles, and legends:
You can add labels, titles, and legends to your plots to provide context and clarity. Here's how:
Different types of plots:
Matplotlib supports various types of plots including line plots, scatter plots, bar plots, histograms, etc. You can choose the appropriate type based on your data and visualization needs. For example:

Subplots and multi-axis plotting:
You can create multiple subplots within a single figure using subplot() function. This allows you to visualize multiple plots side by side. Here's an example:

Saving plots to file:
You can save your plots as image files using the savefig() function. Matplotlib supports various file formats such as PNG, PDF, SVG, etc. Here's how to save a plot:

Bringing It All Together: A Practical Example
To solidify our understanding of these libraries, we'll walk through a practical example that combines data manipulation with Pandas, numerical computations with NumPy, and visualization with Matplotlib. We'll start with raw data, clean and manipulate it using Pandas, perform some analysis with NumPy, and visualize the results using Matplotlib.
Project
Suppose we have a dataset containing information about monthly sales of a store over the past year. Each row represents a month, and the columns include the month, total sales, and expenses. We want to perform some analysis on this dataset using Pandas, NumPy, and Matplotlib.
Import Libraries
First, we import the necessary libraries.

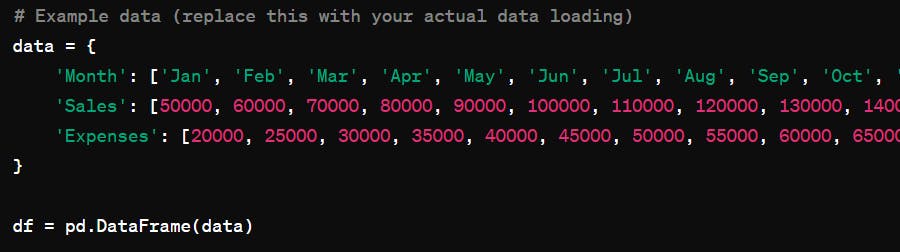
Load Data
We load our dataset into a Pandas DataFrame.
Data Manipulation
We can perform some basic data manipulations, such as calculating profit and adding it as a new column.

Analysis with NumPy
We can perform some numerical analysis using NumPy, such as calculating mean, median, and standard deviation of sales and expenses.

Visualization with Matplotlib
Finally, we can visualize our data using Matplotlib. For example, we can create a line plot showing the trend of sales and expenses over the months.

Summary
Above you found out some basic topics of the pandas numPy and matploitlib here I will provide you a youtube link where you will learn in detail about it for free and also a paid course where the teaching is same as youtube but you will have a certified certificate
Links
https://www.youtube.com/watch?v=GPVsHOlRBBI&t=0s
https://jovian.ai/learn/data-analysis-with-python-zero-to-pandas
If you enjoy my blog content do follow, Thank You!!